The Good Bad and Ugly weekly review : 16 Feb 2024
Markets this week
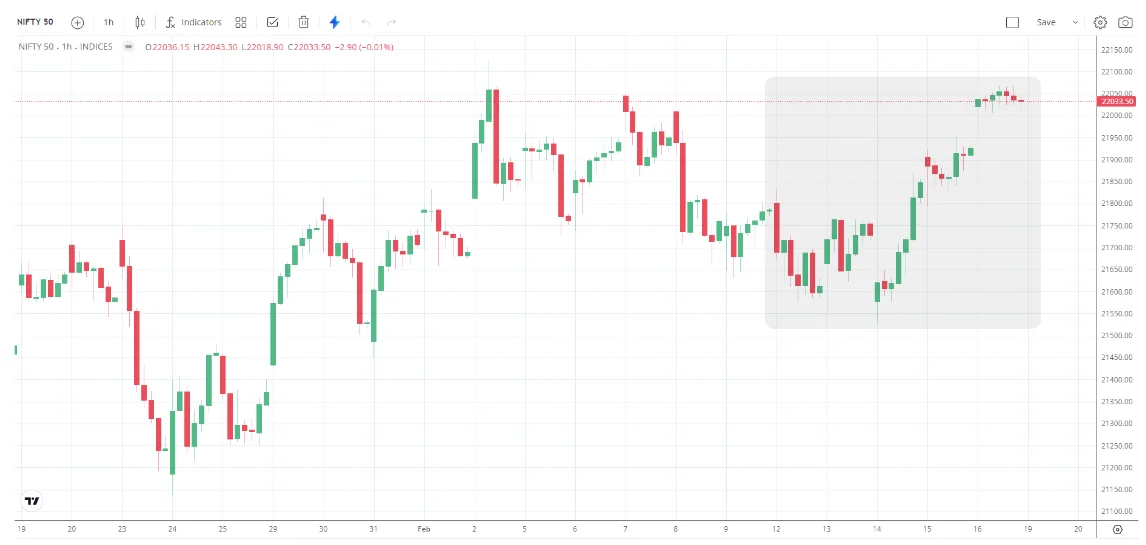
Nifty 50 came back really well clocking 1.2% this week but finds itself near the resistance of the double top pattern around previous highs at 22100. The upcoming week will be very critical to see if Nifty 50 can get going on the next leg of uptrend.
Benchmark Indices & WeekendInvesting Overview
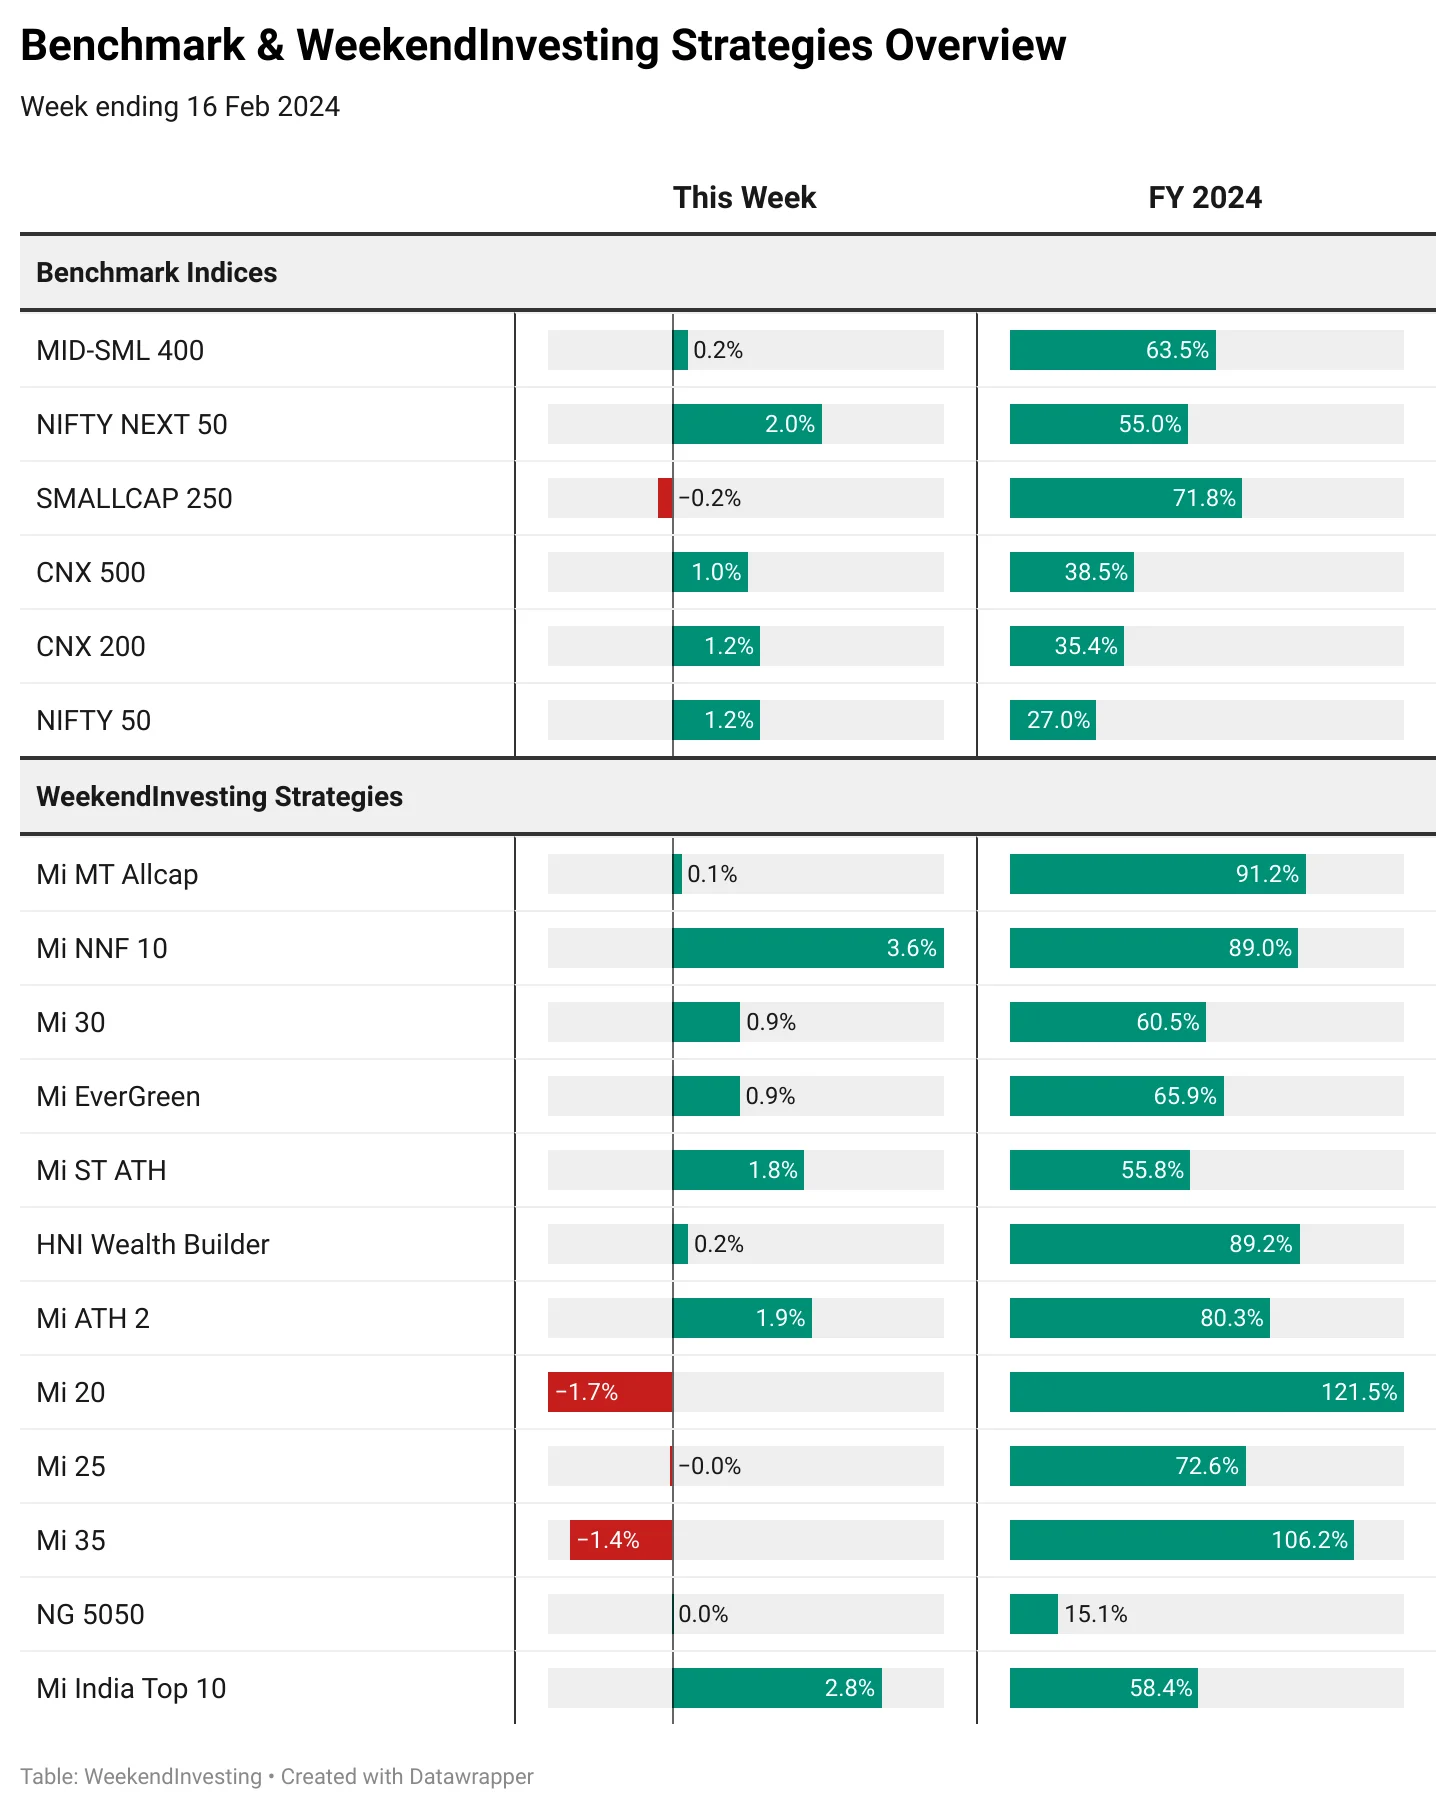
Smallcap 250 faced a bit of correction this week recording muted gains but still leads the FY 24 chart with a solid performance of 71%. Nifty Jnr has also put on a phenomenal show recording gains of 55% in FY 24.
Mi NNF 10 continues to do remarkable well clocking 3.6% this week extending its FY 24 gains to a stupendous 89%. Mi India Top was the second best performer this week clocking 2.8% gains followed by Mi ST ATH and Mi ATH 2. Mi India Top 10 has also performed exceptionally well in FY 24 for a Nifty 50 based strategy with gains of 58% compared to only 27% on its benchmark.
Sectoral Overview
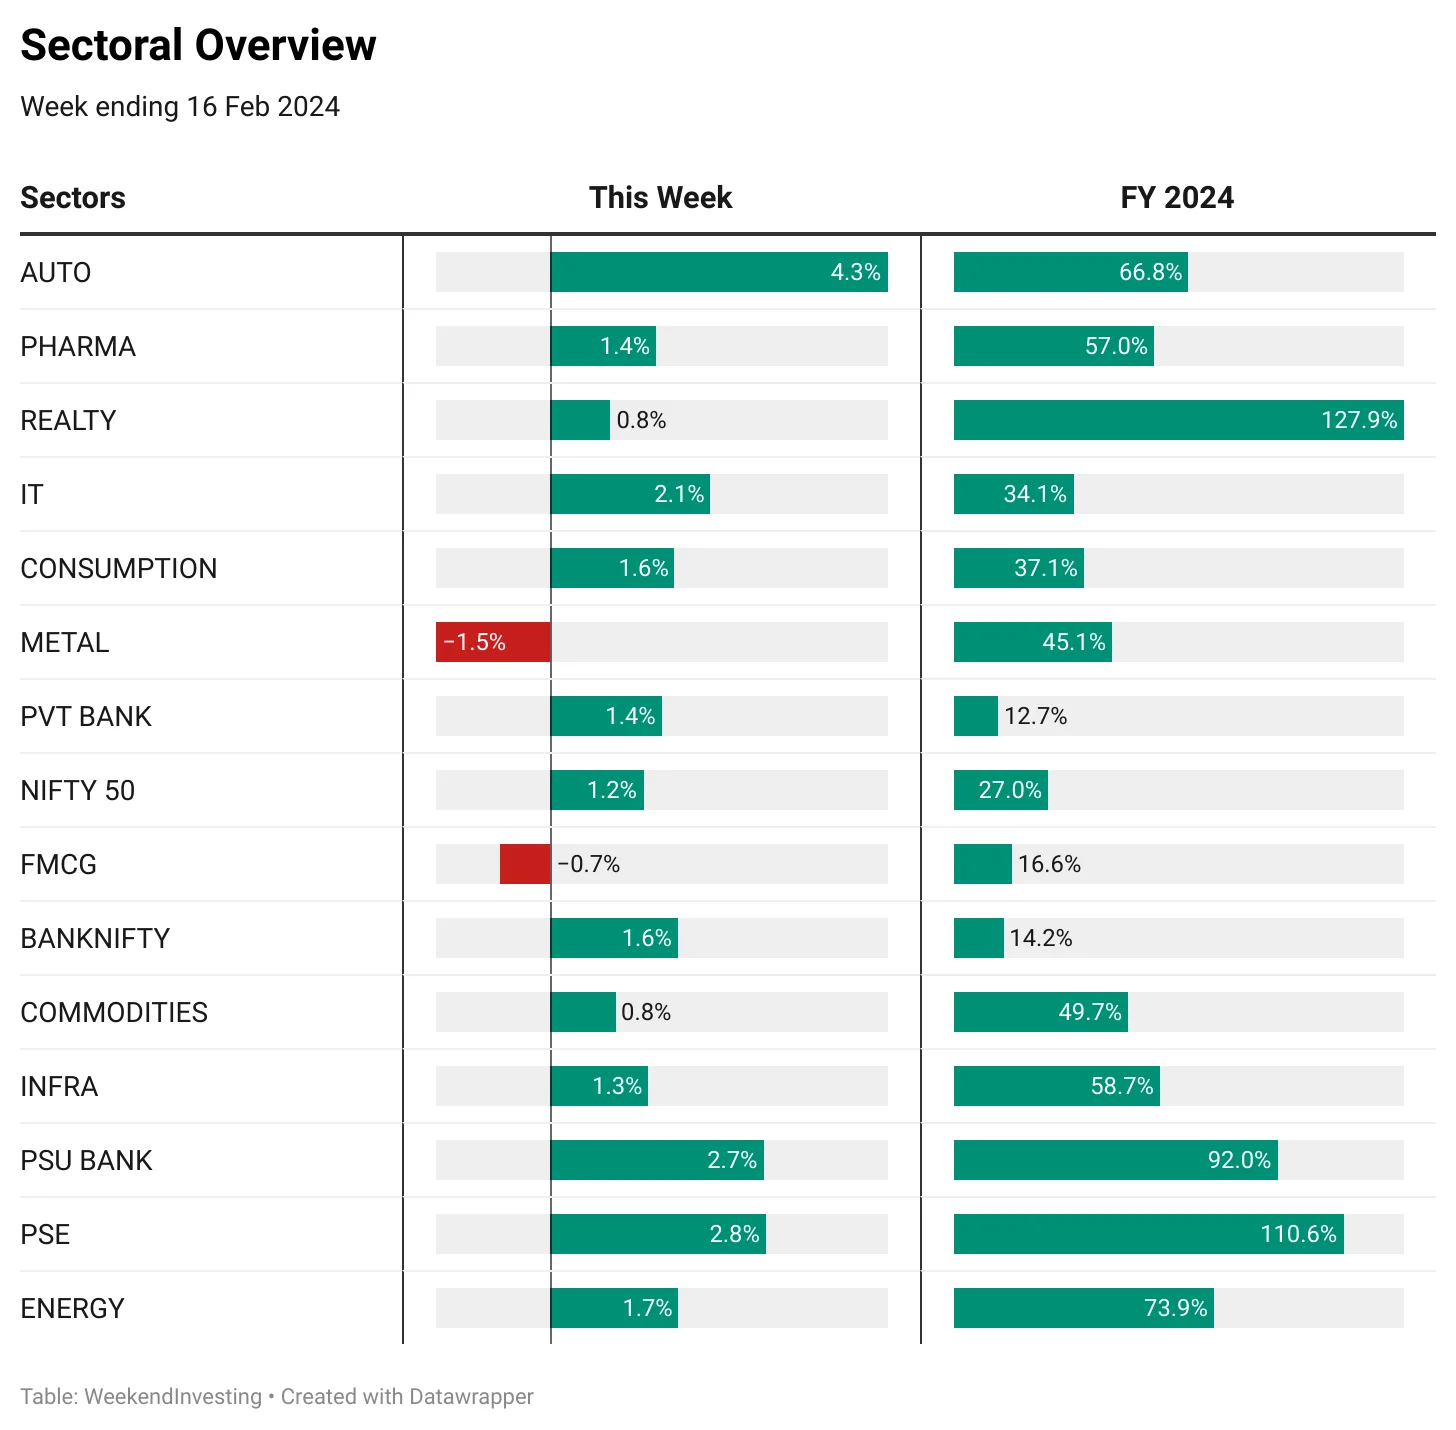
AUTOs did really well to record 4.3% this week followed by PSE and PSU BANKS at around 2.7% each. METALS had underperformed significantly recording a loss of 1.5% along with FMCG losing around 0.7%.
On the FY 24 front, REALTY remains the topper clocking 128% despite the recent correction. PSE is the next sector to join the 100% club in FY 24 with PSU BANKS inching close to that coveted mark.
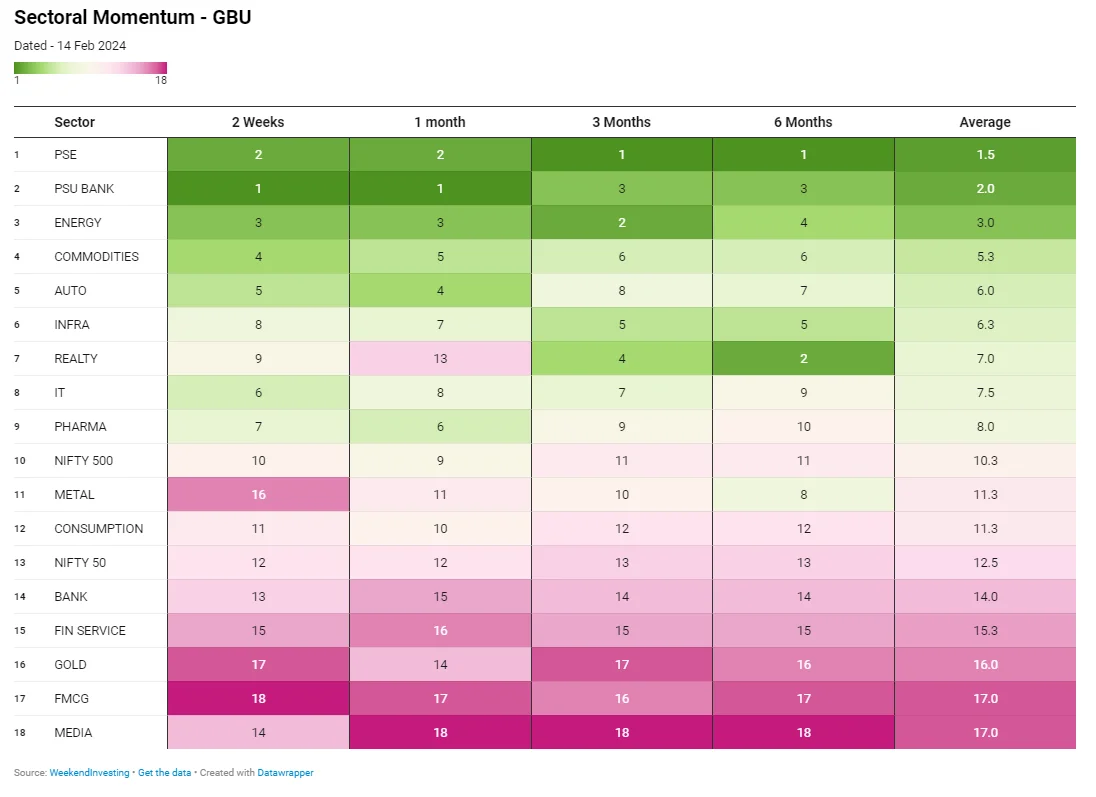
PSE continues to hold on to the #1 spot with some really consistent performance despite losing the Fortnightly and monthly top spot to PSU Banks. ENERGY & COMMODITIES have done well to hold on to the #2 and #3 spots. REALTY has slipped to #7 after losing steam in the last 30 days especially. The sector is still in #2 in terms of the 6 month performance. METALS have lost some ground while FMCG, MEDIA and BANKS continue their strong hold at the bottom.
Spotlight – Multibagger PFC in Mi MT Allcap
PFC (Power Finance Corporation) stands as a classic example of the impact of a multi year breakout. The stock was trapped between Rs 35 and Rs 135 for almost 13 years and finally broke out of this range in early 2023 and has now clocked a fantastic 3x from there.
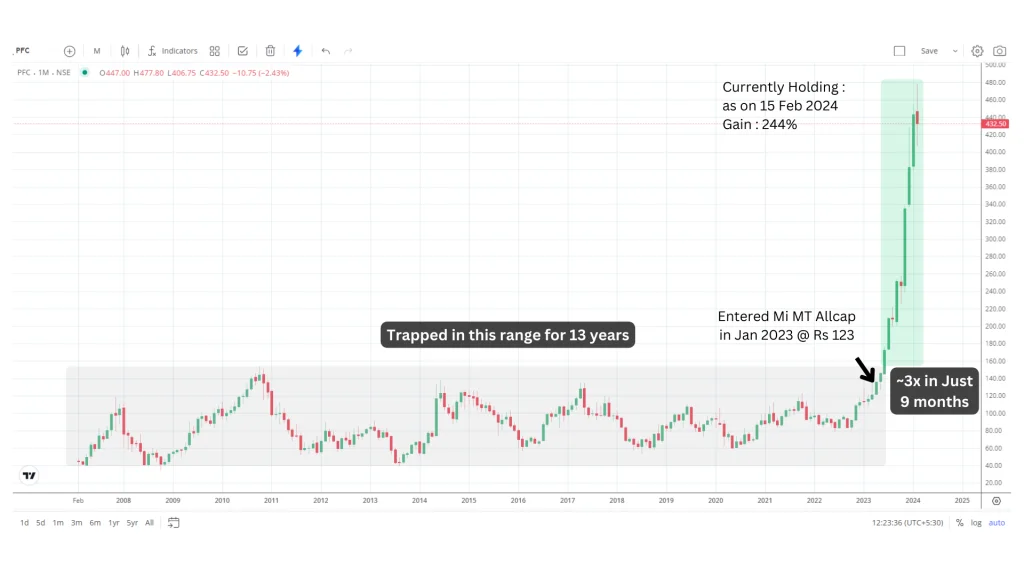
Mi MT Allcap picked up this stock back in Jan 2023 @ Rs 123 and is currently a beneficiary of the the stupendous performance of this stock which has become a 3.4x bagger.
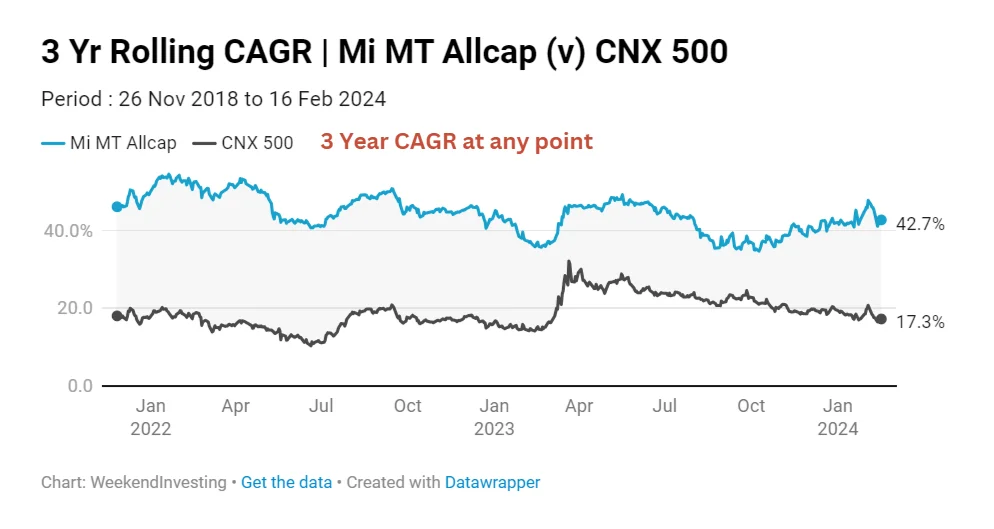
The above chart denotes the CAGR of Mi MT Allcap in the latest 3 year period. You can see that the strategy has seen a massive outperformance compared to CNX 500 by staying within a very healthy 3 year CAGR range of 35% to 45% while that of CNX 500 oscillated between 15% to 25%.
Check out Weekend Investing smallcases here
Weekendinvesting Analytics Private Limited•SEBI Registration No: INH100008717
B- 6/102, SAFDARJUNG ENCLAVE, NEW DELHI South West Delhi, Delhi, 110029
CIN: U72900DL2021PTC380866
Disclaimer: Investments in securities market are subject to market risks. Read all the related documents carefully before investing. Registration granted by SEBI, membership of BASL (in case of IAs) and certification from NISM in no way guarantee performance of the intermediary or provide any assurance of returns to investors
Disclosures: Link

You may want to read


