Is the Santa Claus Rally Real? Randomness or Seasonal Trends for Global & Indian Stock Markets

The Santa Claus rally, a phenomenon in the stock market, is characterized by a rise in stock prices during the last five trading days of December and the first two trading days of January. This event has consistently occurred since Yale Hirsch first documented it in the “Stock Trader’s Almanac” in 1972. Historical data supports the existence of this rally, with the S&P 500 typically gaining an average of 1.3% during this seven-day stretch. The occurrence has been observed more than 75% of the time since 1950. The reasons behind this rally may range from investor optimism for the new year, holiday spending, reduced trading activity due to holidays, or institutional investors settling their books.
In recent years, the trend has continued with only a few exceptions. For example, in 2021, the S&P 500 not only adhered to the rally but also reached new highs, emphasizing the market’s tendency for an uptick during this period. However, 2022 was different. We saw US markets hit back with fears of recession & banking collapses – which meant there was no rally last year.
Despite this there has been some consistency in this trend. The Santa Claus rally’s impact is not just of academic interest; it’s also seen as a precursor to the market’s performance in the new year. Yale Hirsch’s famous saying, “If Santa Claus should fail to call, bears may come to Broad and Wall,” indicates that a lack of a rally could be a bearish signal for the market. It’s crucial to approach the Santa Claus rally with a level of scrutiny, as past performance is not always indicative of future results, and without comprehensive statistical analysis, it’s difficult to ascertain the rally’s significance beyond historical patterns. So, in today’s article we will look at this well-documented rally across global markets and see if it applies to Indian markets as well.
What is the Santa Claus Rally?
The Santa Claus rally, an anticipated stock market pattern, often brings a period of increased prices during the tail end of December and the start of January. Analysis of historical data from the S&P 500 indicates that November through January are profitable months, with gains often exceeding 1.0%. Specifically, the last five trading days of December and the first two of January show a median increase of 1.08%.
Despite these patterns, there is debate over the rally’s statistical significance. Without error bars or detailed statistical analysis, it’s challenging to determine if the rally is a consistent phenomenon or a result of random fluctuations. We will look at evaluating the validity of the Santa Claus rally.
History of Santa Claus Rally
The roots of the Santa Claus rally can be traced back to the early 1900s. Sidney B. Wachtel was one of the first to analyze this seasonal market behavior, using the DJIA to examine fluctuations from December to January as early as 1942. However, the term “Santa Claus rally” was not popularized until Yale Hirsch mentioned it in “The Stock Trader’s Almanac” in 1972.
Over the years, the nature of the rally has evolved. Initially marked by a rise before the holidays followed by a sell-off, the trend has shifted. From the late 1960s through the 1970s, the rally duration also changed, with the market’s upward movement often lasting eight days.
The rally has been recorded across major indices, with the S&P 500 showing a monthly average gain of 1.7% since 1969 and the Nasdaq posting a notable increase of 2.1% in 1971. These gains demonstrate that the rally has been a persistent aspect of the stock market’s year-end behavior.
Data behind Santa Claus Rally
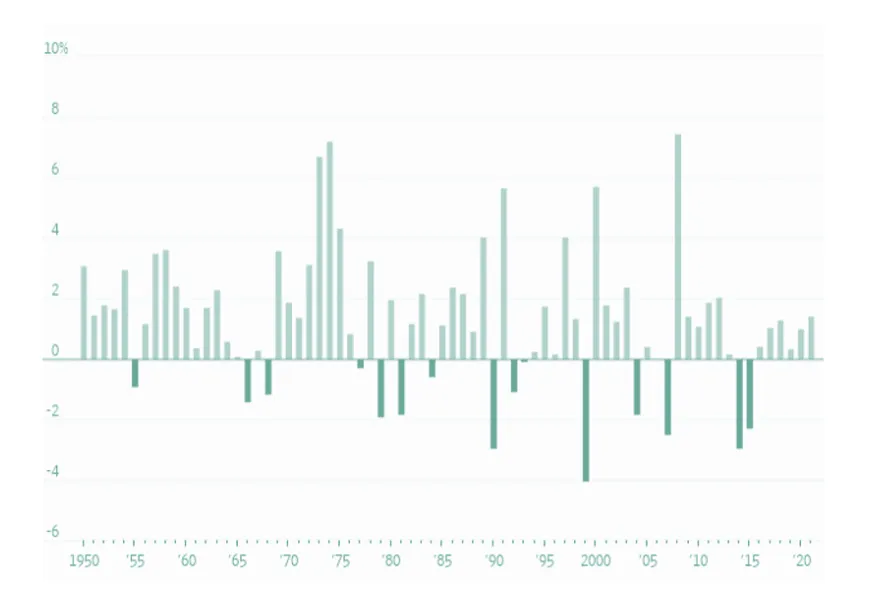
Since 1950, the S&P 500 has seen an average gain of 1.32% during this period, with positive trades occurring 78% of the time. This pattern is not unique to the S&P 500; the Dow Jones Industrial Average also experiences a similar uplift, averaging a 1.38% increase during the holiday season, with a frequency of 79% since 1950. These statistics underscore the historical consistency of the rally.
An in-depth statistical analysis of S&P 500 performance from 1951 to 2014 during the days following Christmas reveals notable patterns. On average, the first to sixth trading days after Christmas exhibited positive returns, while the subsequent days tended to show negative returns. When compared to the global average daily gain of 0.03%, the initial days after Christmas presented higher positive gains, with the first, third, and sixth days showing statistically significant differences.
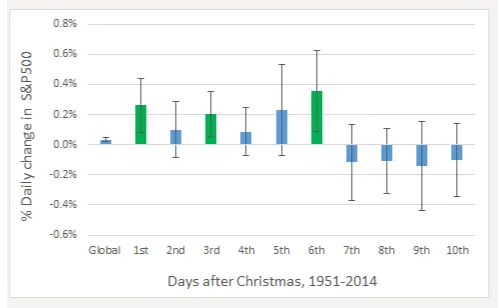
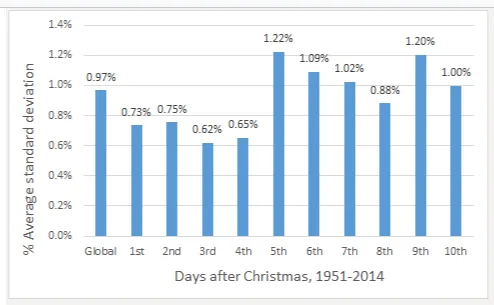
Incorporating 95% confidence intervals into the analysis sheds further light on the data. Only the gains on the first, third, and sixth days after Christmas significantly exceeded the global average, suggesting that not all post-Christmas trading days are equally bullish. Additionally, when examining standard deviations, the first four days after Christmas showed less variability compared to the latter six days, contradicting the idea that post-Christmas volatility is generally lower.
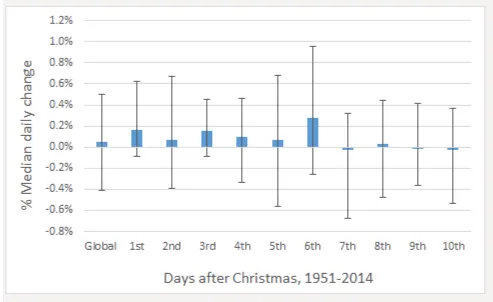
Another perspective is provided by analyzing median daily changes alongside lower and upper quartiles, which represent the middle 50% of all data points. This analysis indicates a greater variability than what is observed with average daily changes alone.
The charts reflect a clear trend of late December and early January outperformance in the stock market, a phenomenon that market strategists and historical data have long recognized. The positive movement of the market during this period has been documented and observed repeatedly, suggesting a pattern that goes beyond mere coincidence. However, it is essential to understand that the existence of a pattern does not guarantee future results, and investors should be wary of relying solely on such trends for investment decisions.
Positive Days From the Santa Claus Rally
Analyzing the frequency of positive days in the stock market following Christmas from 1951 to 2014 sheds light on the nature of the Santa Claus rally. According to historical S&P 500 data, the market has had positive days 53% of the time. However, the ten days after Christmas show a slightly higher average of 56% positive days. This difference, while minor, aligns with the festive period’s market optimism.
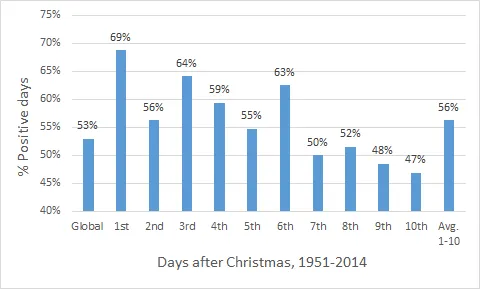
The first day after Christmas boasts the highest probability of a positive outcome at 69%, with the initial six days post-Christmas all showing higher chances of gains compared to the year-round average. On the contrary, the last four days of this period dip below the global average, with the final two days more likely to experience losses than gains. This trend mirrors the previously discussed average daily change rates.
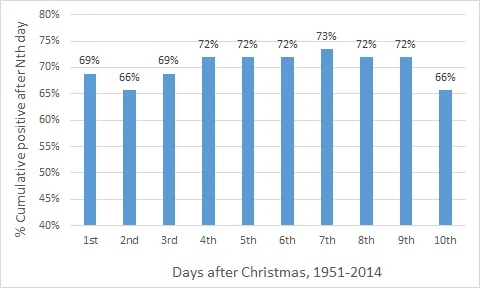
When considering cumulative gains, the likelihood of maintaining a profit if one were to invest at the close of Christmas day remains impressively stable at above two-thirds (66%) for the entire 10 day period post-Christmas. This consistency suggests that despite day-to-day fluctuations, the overall direction in the aftermath of Christmas leans towards positive returns, reinforcing the existence of the Santa Claus rally effect.
This Christmas, Are you bullish on the India’s Growth Story? Start with the New India Smallcase.
Causes of the Santa Claus rally
The Santa Claus rally, a term describing the tendency for the stock market to experience gains during the final week of December into the new year, lacks a definitive explanation. However, several theories attempt to rationalize this phenomenon:
Optimistic Outlook for the New Year:
- The period between Christmas and New Year’s is often associated with hope and positivity about the future, which can reflect in investor behavior.
- With the receipt of end-of-year bonuses and monetary gifts during the holidays, individuals have additional funds to invest, which could boost the stock market.
- Investors may also purchase stocks in anticipation of the January effect, an expected seasonal increase in stock prices. The effect is partly attributed to the reinvestment of funds following tax loss harvesting in December.
Influence of Institutional Investors:
- Institutional investors tend to reduce their market activities as they close their books at the year’s end, resulting in shallower market volumes and leaving room for retail investors to exert more influence on the market.
- Many institutional investors go on holiday after Christmas, leading to lower trading volumes. This environment may amplify the impact of retail investors’ actions, who are generally more optimistic and bullish, potentially driving prices up.
US Market Sentiments:
- US stock market has historically set the tone for global markets. Positive momentum in US stocks can influence investor sentiment internationally, and the reverse is true for negative trends.
- Investors may begin reinvesting funds that were sold off for tax loss harvesting purposes at the end of December, leading to increased demand for stocks.
- As the Santa Claus rally becomes more widely recognized, investors may buy stocks simply because they expect the rally to occur, thereby actually causing it to happen.
The true cause of the Santa Claus rally may involve a combination of these factors or be influenced by other, less obvious market dynamics.
Santa Claus Rally in Indian Markets
Data suggests that the positive sentiment often seen in the U.S. during this period can extend to the Indian stock market , though various other factors inherently affect market performance in India, and there’s no absolute certainty that the rally will occur every year. We can see a similar trend where the Nifty appears to follow movements in S&P500 most of the time.
| Year | S&P 500 (%) | Nifty (%) |
| 2020 | 0.8 | 2.2 |
| 2019 | 0.9 | 1.7 |
| 2018 | -4.4 | 0.5 |
| 2017 | -0.1 | 1.9 |
| 2016 | -0.9 | 0.6 |
| 2015 | 0.1 | 0.4 |
| 2014 | -0.1 | 0.9 |
| 2013 | 0.4 | 0.4 |
| 2012 | -1.7 | 0.9 |
| 2011 | -0.6 | -1.9 |
Historically, the Nifty 50 has experienced the Santa Claus rally in 13 out of the past 16 years. This trend is indicative of a strong year-end performance in the Indian markets, aligning with the global pattern of the Santa Claus rally. The Economic Times reported that over the past 21 years from 2001 till 2021, Nifty has provided an average return of about 2% during the seven days of the Santa Claus rally.
Santa Claus Rally as we enter 2024
The historical data presents a compelling case for the Santa Claus rally being a significant event more so for US & other developed economy stock markets, offering a 66% or greater chance of profitability if an investment is made just before Christmas and held for the following ten days. The optimal historical strategy would involve buying at the close of Christmas day and selling six days later, which has shown an average cumulative return of +1.2%, with a 95% confidence interval ranging between 0.9% and 1.5%. There also appears to be historical data for Indian stock markets that shows it is more than likely a rally occurs as we approach the end of the calendar year.
And well, it looks like Indian stock markets & even global stock markets have already had an early Santa Claus rally. A wave of optimism had swept major economies as key stock market indices in the US, Germany, France, and India reached historic levels. The Dow Jones, DAX, CAC, and Nifty all register all-time highs, marking a significant milestone. However on Wednesday on the back of rising Covid fears, profit-booking, the second half saw a bloodbath.
Check out Wright Momentum smallcase here!
Wright Research & Capital Pvt Ltd•SEBI Registration No: INA100015717
103, Shagun Vatika Prag Narayan Road, Lucknow, UP 226001 IN
CIN: U67100UP2019PTC123244
Disclaimer: Investment in securities market are subject to market risks. Read all the related documents carefully before investing. Registration granted by SEBI, membership of BASL and certification from NISM in no way guarantee performance of the intermediary or provide any assurance of returns to investors. The content in these posts/articles is for informational and educational purposes only and should not be construed as professional financial advice and nor to be construed as an offer to buy/sell or the solicitation of an offer to buy/sell any security or financial products. Users must make their own investment decisions based on their specific investment objective and financial position and use such independent advisors as they believe necessary.
Disclosures: Link
You may want to read


