630 Days of Smallcap Carnage: How One Portfolio Walked Away With Just a Scratch

Between March 2023 and September 2024, the universe of smallcap companies delivered a staggering 120% return, leaving investors sitting on gains few would have thought possible. By June 2026, most of those gains were gone. The Nifty Smallcap 100 had fallen 2.7% over a brutal 630-day stretch, and the funds built around quality and momentum, the strategies investors trust most, fell even harder. One portfolio, built on those same factors, should have fallen with them.
Instead, it held at -0.7%. This write-up sifts through a lot of data to help understand how that happened, with the help of the Quality Smallcap Quant smallcase.
Smallcap Carnage in Numbers
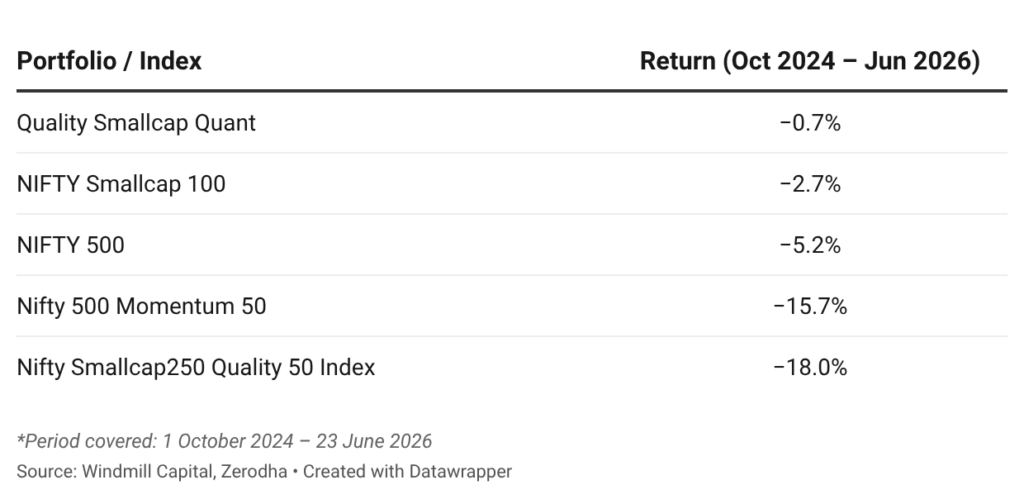
The broad market Nifty 500 index fell 5.2%. Quality Smallcap Quant, which invests exclusively in small caps, beat the broad market by nearly 450 basis points. That’s an unusual outcome!
But look further down the table. The Nifty 500 Momentum 50, a momentum-focused index, fell 15.7%. The Nifty Smallcap250 Quality 50, which selects quality companies from the smallcap universe, fell 18%.
So neither momentum nor quality worked. Both took a significant hit! And yet the Quality Smallcap Quant, which runs both quality and momentum screens on the riskiest segment of the market, ended nearly flat. The factors alone are not what saved it.
What actually saved it: The tactical shift to gold
The Quality Smallcap Quant attempts to shortlist at least 10 stocks that meet the stringent quality and momentum criteria. If that’s not possible, the remaining capital is allocated to gold ETFs as a defensive holding.
In normal conditions, this rule rarely gets triggered. When markets are healthy, there are plenty of quality smallcap businesses with positive price momentum. But when conditions deteriorate and businesses start struggling, momentum falls, and the number of names passing both the quality filter and a positive momentum test shrinks quickly. The portfolio’s response is automatic: as qualifying names disappear, capital rotates out of equities and into gold.
The rule rarely triggers — the portfolio had last held gold in April 2023. When markets started deteriorating in late 2024, qualifying stocks became harder to find, and the portfolio began moving capital into gold from March 2025 onwards. From March 2025 to June 2026, the average gold holding was 45% of the total portfolio weight. This matters enormously because Gold Bees returned 57.4% over its 445-day hold in the smallcase. Gold did not just act as a defensive placeholder; it was the portfolio’s best performing position while equities were falling.
The -0.7% portfolio return is a mixed result: losses in the equity portion were offset by significant gains in gold. The size of the gold allocation at each rebalance has determined how much of those gains flowed through to the smallcase.
It is important to note that the alpha came from the exit, not the stock selection.
What the equity portion actually looked like
It is also crucial to candidly look at the stock selection during this period.
Across 17 rebalances since October 2024, the portfolio held 22 individual equity positions. 14 of those generated negative returns, averaging -14%. 8 generated positive returns, averaging 14.1%. More positions lost money than returned profits. And this is what picking a small-cap stock during a sustained downturn looks like.
However, the screening criteria prevented the smallcase from holding positions longer than it should have. Historically, the average hold duration for positions that eventually turned negative has been around 105 days. During this downturn, it dropped to 96 days. The screens were cutting losses roughly 9 days faster than usual. In a period of sustained selling pressure, exiting earlier, even if it is just 9 days, means less capital eroded and more capital available to rotate into gold. The screens did not prevent losses, but they limited how long the smallcase stayed exposed to them.
The rolling returns picture
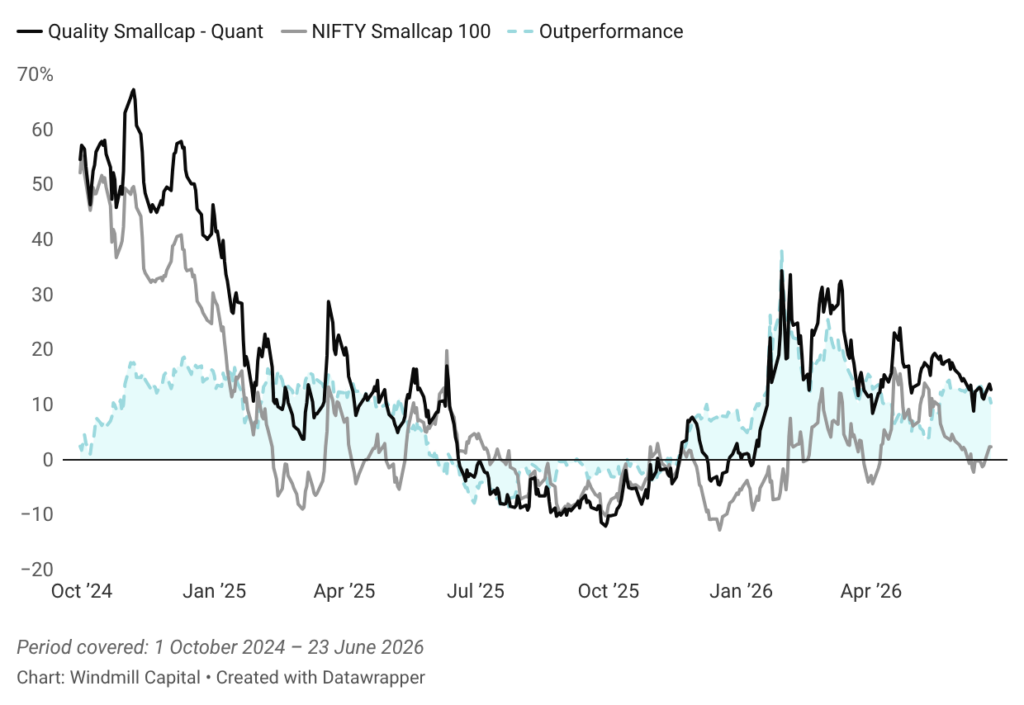
We can better understand the point-by-point numbers by examining the rolling returns from September 2024 to June 2026.
The early months, October through December 2024, were the tail end of the smallcap bull run. Both the smallcase and the comparable index were generating 40–60% rolling returns, with the smallcase returns running ahead. The screens were finding plenty of qualifying names, gold allocation was minimal, and the smallcase was fully in equities, capturing the upside.
From January 2025 onward, both returns fell sharply, tumbling towards zero, and briefly went negative around mid-2025. The quality filter alone was not able to shore up the smallcase returns. When a broad sell-off hits, even high-quality portfolios decline. What changed was the growing allocation to gold, which helped cushion portfolio returns.
From September 2025 onwards, the smallcase consistently outperformed the comparable index. The outperformance widened and has held through so far in 2026. The portfolio recovered faster and more cleanly, partly because it had less equity exposure to recover from, and partly because the gold gains were already in the portfolio.
An honest assessment
The data from October 2024 to June 2026 tell a specific story: during a prolonged smallcap downturn, the smallcases’ construction criteria, especially the automatic rotation into gold when qualifying stocks run dry, outperformed every comparable benchmark and style index by a significant margin.
The style factors, quality, momentum, or both did not protect investors during this period, as the index returns clearly show. What worked was the tactical response embedded in the portfolio’s rules, a mechanism that reduced equity exposure and moved into an asset that performed exceptionally well precisely when equities were struggling.
For investors in the smallcase, the takeaway is straightforward. The 630-day drawdown has been uncomfortable, and the smallcase has not been immune to it. But the construction responded as it was designed to, and the outcome, nearly flat against a market that fell significantly harder on every comparable benchmark, reflects that.
Disclaimer: Investment in securities market are subject to market risks. Read all the related documents carefully before investing. Registration granted by SEBI, membership of a SEBI recognized supervisory body (if any) and certification from NISM in no way guarantee performance of the intermediary or provide any assurance of returns to investors.
The content in these posts/articles is for informational and educational purposes only and should not be construed as professional financial advice and nor to be construed as an offer to buy /sell or the solicitation of an offer to buy/sell any security or financial products.Users must make their own investment decisions based on their specific investment objective and financial position and using such independent advisors as they believe necessary.
Windmill Capital Team: Windmill Capital Private Limited is a SEBI registered research analyst (Regn. No. INH200007645) based in Bengaluru at No 51 Le Parc Richmonde, Richmond Road, Shanthala Nagar, Bangalore, Karnataka – 560025 creating Thematic & Quantamental curated stock/ETF portfolios. Data analysis is the heart and soul behind our portfolio construction & with 50+ offerings, we have something for everyone. CIN of the company is U74999KA2020PTC132398. For more information and disclosures, visit our disclosures page here.

You may want to read
 Logic Behind Our Rebalance Decisions – Mar 2024 Edition
 smallcase in focus – Value & Momentum
 Decoding the Disconnect: Why Low-Growth Stocks Are Trading at High Multiples
