Glide-Path Investing: How Your Portfolio Changes as Your Goal Approaches

When planning for a long-term goal, most investors focus on two main factors: maximizing returns and managing risk. But there is a third, equally critical variable that often gets overlooked – the timeline.
A market crash is manageable when your goal is a decade away because your portfolio has time to recover. But if that same crash happens right before you need the money, it can disrupt your plans, forcing you to compromise on your goal or lock in losses by selling at a market low.
This raises an essential question: Should your portfolio strategy remain static, or should it adapt as your goal gets closer?
Let’s compare two distinct investment approaches to see how a changing asset allocation impacts the investment journey over time.
1. Two investors, two different strategies
Imagine two investors who each invest ₹1 lakh in the NIFTY 100 index on 6 October 2023.
Investor 1: Stays invested in equity
The first investor keeps the entire investment in NIFTY 100 until 5 October 2026. When the market rises, the portfolio benefits. When the market falls, the portfolio falls too. The investor remains fully exposed to equity-market movements throughout the three years.
Investor 2: Gradually moves money into cash
The second investor follows a different approach. They begin with the same ₹1 lakh in NIFTY 100 but move 10% of the total portfolio value from equity into cash every year. The money moved into cash no longer participates in subsequent equity-market movements.
The purpose is not to predict when the market will fall. Instead, the investor gradually reduces the amount of money exposed to equity-market risk as the investment journey progresses.
By adjusting the asset mix on a set schedule, the investor systematically de-risks the portfolio over time without attempting to time the market.
2. How did their investments perform?
Let us compare the two portfolios over the three-year period from 6 October 2023 to 5 October 2026.
Both investors started with ₹1 lakh. Investor 1 remained fully invested in NIFTY 100, while Investor 2 gradually shifted part of the portfolio into cash.
Portfolio value after three years
| Metric | Investor 1: 100% NIFTY 100 | Investor 2: Gradual shift to cash |
| Starting investment | ₹1,00,000 | ₹1,00,000 |
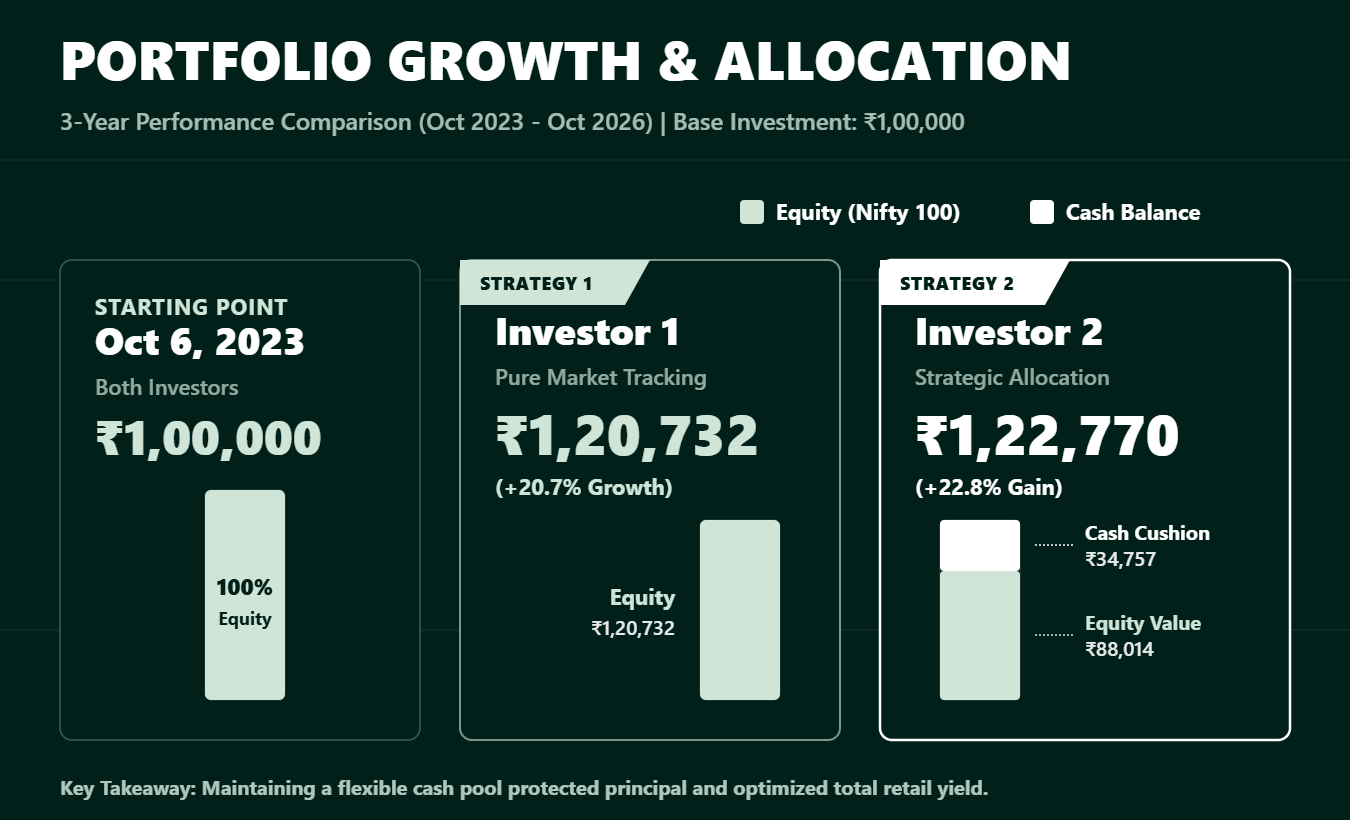
| Final portfolio value | ₹1,20,732 | ₹1,22,770 |
| Total return | 20.7% | 22.8% |
| Annualised return (CAGR) | 6.5% | 7.1% |
Over this period, Investor 2 ended with a higher portfolio value. One reason is that the NIFTY 100 declined between October 2025 and October 2026. Since Investor 2 had already moved some money into cash, that portion was protected from the subsequent equity-market decline.
What happened to Investor 2’s portfolio each year?
The following table shows how the portfolio evolved as money was gradually shifted out of equity.
| Date | Equity value | Cash value | Total portfolio |
| Oct 2023 – Start | ₹1,00,000 | ₹0 | ₹1,00,000 |
| Oct 2024 – Year 1 | ₹1,18,332 | ₹13,148 | ₹1,31,481 |
| Oct 2025 – Year 2 | ₹1,06,464 | ₹24,977 | ₹1,31,442 |
| Oct 2026 – Year 3 | ₹88,014 | ₹34,757 | ₹1,22,770 |
Notice how the portfolio changes over time. At the end of the period, Investor 2 has approximately 71.7% of the portfolio in equity and 28.3% in cash. Investor 1, by contrast, remains fully invested in equity.
3. How did their risk differ?
Portfolio value tells us how much money an investor has accumulated, but it does not tell us how difficult the investment journey was. Two portfolios can generate similar returns while experiencing very different fluctuations along the way.
Risk comparison over three years
| Risk measure | Investor 1: 100% NIFTY 100 | Investor 2: Gradual shift to cash |
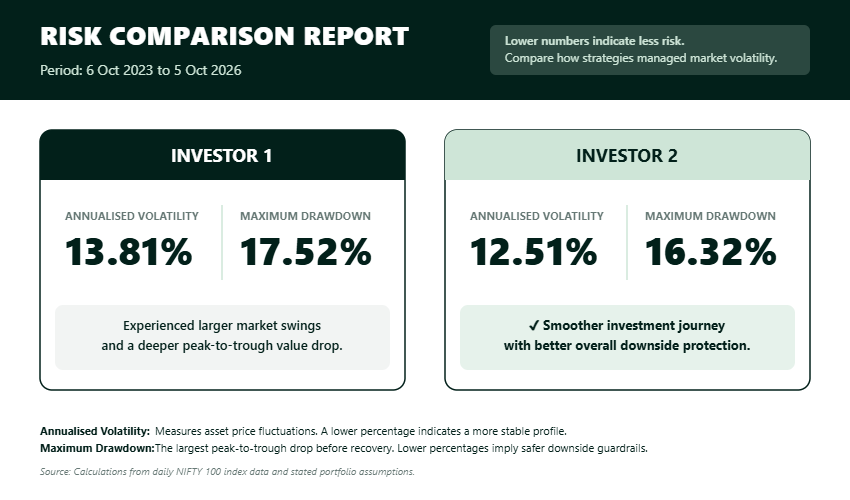
| Annualised volatility | 13.81% | 12.51% |
| Maximum drawdown | −17.52% | −16.32% |
Investor 2 experienced lower annualised volatility and a smaller maximum drawdown over this period. The cash allocation helped cushion the impact of the market decline because the money already moved into cash did not fall with the equity market.
However, the difference was not dramatic. Investor 2 still held a substantial portion of the portfolio in equities, so the portfolio continued to experience market risk. Moving money into cash reduces exposure; it does not eliminate losses or guarantee a better outcome.
4. Why does a glide path matter as a goal approaches?
The example highlights an important distinction between investing for growth and investing for a goal with a specific deadline.
Equities can be useful for long-term wealth creation, but they can also experience sharp declines. If an investor needs the money soon, there may be limited time to wait for a recovery.
Gradually shifting capital away from equities addresses this timeline risk in three key ways:
- Reducing equity exposure: Less of the portfolio remains directly exposed to equity-market movements.
- Managing downside risk: Assets held outside equities may cushion the effect of an equity-market decline, although they carry their own risks.
- Providing a predefined approach: Investors have a planned allocation strategy instead of needing to decide when and how much to move out of equities on their own.
The key is that a glide path does not attempt to predict the next market downturn. It establishes how the portfolio should evolve as the investor gets closer to the date when the money is needed.
The exact allocation and pace of change depend on the strategy. Moving money into cash, as in our example, is one simple way to illustrate the principle; a real portfolio may use a combination of asset classes.
5. The takeaway
Investing for a financial goal is not only about how much money we can accumulate. It is also about how much risk we take along the way and whether the portfolio is suited to the time available before the money is needed.
Glide-path investing aligns your portfolio’s risk profile with your timeline.
We built this framework into our Horizon smallcases so investors can focus on long-term wealth creation early on, while automatically shifting toward capital protection as their target date nears.
Disclaimer: Investment in securities market are subject to market risks. Read all the related documents carefully before investing. Registration granted by SEBI, membership of a SEBI recognized supervisory body (if any) and certification from NISM in no way guarantee performance of the intermediary or provide any assurance of returns to investors.
The content in these posts/articles is for informational and educational purposes only and should not be construed as professional financial advice and nor to be construed as an offer to buy /sell or the solicitation of an offer to buy/sell any security or financial products.Users must make their own investment decisions based on their specific investment objective and financial position and using such independent advisors as they believe necessary.
Windmill Capital Team: Windmill Capital Private Limited is a SEBI registered research analyst (Regn. No. INH200007645) based in Bengaluru at No 51 Le Parc Richmonde, Richmond Road, Shanthala Nagar, Bangalore, Karnataka – 560025 creating Thematic & Quantamental curated stock/ETF portfolios. Data analysis is the heart and soul behind our portfolio construction & with 50+ offerings, we have something for everyone. CIN of the company is U74999KA2020PTC132398. For more information and disclosures, visit our disclosures page here.


You may want to read
 Investing in India’s Real Estate Renaissance with Realty Tracker smallcase
 Logic Behind Our Rebalance Decisions – Mar 2024 Edition
 Aditya Birla Capital: A Financial Conglomerate Finding Its Stride