17 Years, 7 Factors, 1 Catch: What Nifty Data Reveals About Factor Investing

Since 2009, six of seven factor-based Nifty indices beat the broad market. But almost every one of them also spent years, sometimes a decade, behind it. This blog explains what factor investing is, and what 17 years of Indian market data say about it.
What is factor investing?
Factor investing means choosing stocks based on a shared trait, rather than picking companies one by one. These traits are called factors. Over long periods, some of them have been linked to higher returns or lower risk.
Think of buying a car. You could pick one by brand or colour. Or you could pick by measurable traits: mileage, safety rating or top speed. Factor investing does the same with stocks. It picks them based on traits you can measure, such as how cheap they are, how fast they are rising, or how steady their prices are.
The best-known factor is value: buying a business for less than it is really worth.
In 2011, Bank of America was in trouble. It faced lawsuits and public anger after the US housing crash, and its share price had collapsed. Most investors were selling. Warren Buffett looked past the bad news. He saw a large bank whose shares were priced far below the value of its assets and earnings. Berkshire Hathaway, his company, invested $5 billion.
As the bank recovered, its share price rose towards its real worth. The investment went on to earn Berkshire many times what it put in.
Buffett is not a rules-based factor investor. But his long record leans on traits that factor investors also target: low prices, strong businesses and steady earnings. He also held on through long stretches when those traits were out of favour. As the data below shows, that patience matters.
The seven factors, in plain words
NSE runs indices that follow each factor using fixed rules. We use one index per factor and compare each to the Nifty 500, which serves as a proxy for the whole market.
| Factor | What it means | Index we use |
| Momentum | Buy stocks whose prices have been rising strongly, and ride the trend | Nifty500 Momentum 50 |
| Quality | Buy financially healthy companies: high profits, strong balance sheets, little debt | Nifty200 Quality 30 |
| Low volatility | Buy stocks whose prices move less than the market, so the ride is calmer | Nifty Low Volatility 50 |
| Value | Buy stocks that look cheap compared with their earnings or assets | Nifty500 Value 50 |
| Size | Buy smaller companies, which have more room to grow but swing more | Nifty Smallcap 100 |
| Dividend | Buy companies that pay out a large share of profits as cash dividends | Nifty Dividend Opportunities 50 |
| Growth | Buy companies growing sales and profits faster than average | Nifty GrowSect 15 (an index of growth sectors, the closest match) |
| Whole market (benchmark) | The yardstick every factor is measured against | Nifty 500 |
About the data
- Period: 1 January 2009 to 27 October 2026, about 17.8 years of daily prices.
- Price returns only: the figures leave out dividends. This understates indices that hold high-dividend stocks, such as Dividend Opportunities, Value and Low Volatility. NSE also publishes total-return versions that add dividends back.
Returns and risk, 2009 to 2026
Momentum earned the most. Quality and Low Volatility gave the best return for the risk taken. Value and Smallcap earned a little more than the market, but with the deepest falls.
Four terms, explained simply:
- CAGR (yearly growth rate): the steady yearly rate that turns the starting amount into the final amount. At 19.3% a year, ₹100 grows to ₹2,331 in 17.8 years.
- Volatility: how much the price usually swings in a year. Higher means a bumpier ride.
- Worst fall (max drawdown): the biggest drop from a high point to the low that followed. A 50% fall turns ₹1 lakh into ₹50,000.
- Return per unit of risk: yearly growth rate divided by volatility. It shows how much return you got for each unit of bumpiness. Higher is better.
| Index | ₹100 grew to | Yearly growth rate (CAGR)* | Volatility (per year) | Worst fall | Return per unit of risk |
| Nifty500 Momentum 50 | ₹2,331 | 19.3% | 19.6% | −39.4% | 0.99 |
| Nifty200 Quality 30 | ₹1,407 | 16.0% | 15.1% | −29.5% | 1.06 |
| Nifty Low Volatility 50 | ₹1,275 | 15.4% | 13.6% | −29.3% | 1.13 |
| Nifty500 Value 50 | ₹1,246 | 15.2% | 23.9% | −66.2% | 0.64 |
| Nifty GrowSect 15 | ₹1,098 | 14.4% | 16.3% | −44.5% | 0.88 |
| Nifty Smallcap 100 | ₹1,071 | 14.2% | 21.1% | −65.1% | 0.68 |
| Nifty 500 (market) | ₹921 | 13.3% | 17.4% | −38.3% | 0.76 |
| Nifty Dividend Opportunities 50 | ₹866 | 12.9% | 16.4% | −38.5% | 0.78 |
*Sorted by yearly growth rate. Price returns, 1 January 2009 to 27 October 2026.
What it shows
- Momentum grew at 6 percentage points per year faster than the market, with only slightly more volatility.
- Quality and Low Volatility beat the market while swinging less. At worst, they fell about 29%, against 38% for the market. In 2020, the Covid crash brought the market down 38%.
- Value and Smallcap fell about 65% at their worst. Their slide started in January 2018, two years before the Covid low. Investors had to sit through that to earn the slightly higher return.
- Dividend Opportunities was the only index to trail the market. Because dividends are excluded, this gap would likely shrink if they were included.
Why one return number can mislead
The table above measures a single stretch: from one start date to one end date. That is called a point-to-point return, and it has four blind spots.
- It depends on the dates you pick. From 1 January 2009 to 27 October 2026, the Nifty 500 grew 13.3% a year. Start a year earlier, on 1 January 2008, and that drops to 7.7%. Start a year later, in 2010, and it is 10.1%. Keep the 2009 start but stop at the September 2024 market peak, and it jumps to 16.0%.
- The rankings can change too. Start in 2010 instead, and Low Volatility edges ahead of Quality. Value’s lead over the market shrinks from 1.9 to 0.6 percentage points a year.
- It describes only one investor: someone who bought on the first day and sold on the last. Most people invest at different times and hold for different periods.
- It hides the journey. Value and Low Volatility both grew about 15% a year. But Value fell 66% on the way, while Low Volatility fell 29%. Few investors sit through a 66% fall.
Rolling returns: a fairer test
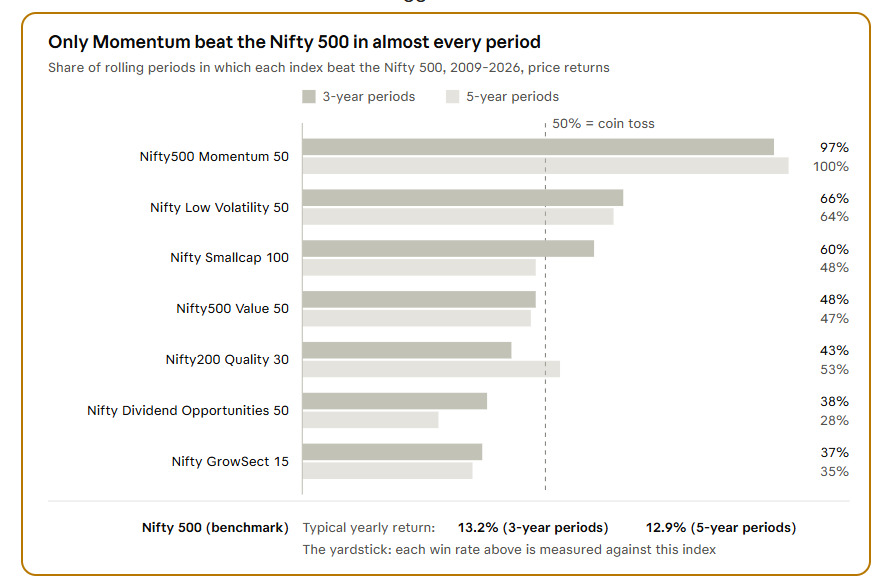
Rolling returns test every possible holding period, not just one. On this test, only Momentum outperformed the market almost every time.
How it works: pick a start day and measure the yearly return over the next 3 years. Then move the start forward by one day and repeat. Doing this for every trading day gives 3,673 three-year periods and 3,172 five-year periods. Each is compared with the Nifty 500 over the exact same dates.
The win rate is the share of periods in which an index beat the Nifty 500. Around 50% is a coin toss. Below 50% means the index lagged the market more often than it led.
The table below shows the typical (median) return for each index. Line up all the periods from worst to best: the median is the one in the middle. We use it instead of the average because a few unusually strong stretches can pull an average up.
| Index | Typical return, 3-year periods | Typical return, 5-year periods |
| Nifty500 Momentum 50 | 20.1% | 21.7% |
| Nifty200 Quality 30 | 13.2% | 14.3% |
| Nifty Low Volatility 50 | 14.8% | 14.6% |
| Nifty500 Value 50 | 13.4% | 11.7% |
| Nifty GrowSect 15 | 13.2% | 12.4% |
| Nifty Smallcap 100 | 15.5% | 12.5% |
| Nifty 500 (market) | 13.2% | 12.9% |
| Nifty Dividend Opportunities 50 | 11.3% | 10.1% |
What it shows
- Momentum was the most consistent winner, earning about 20% a year in a typical period. Remember that most of this history is a backtest.
- Low Volatility was the steadiest of the rest, beating the market about two times in three.
- Quality’s lead came in bursts. Its typical 3-year return matched the market’s 13.2%.
- Smallcap looks better over 3 years than over 5. Its typical return falls from 15.5% to 12.5%, below the market.
- Value was close to a coin toss. Whether it paid off depended on when you bought.
- GrowSect and Dividend Opportunities lagged the market in most periods.
One caution: the periods overlap. 17.8 years of data holds only about six separate 3-year periods. Read these figures as rough tendencies, such as “about 2 in 3”, not exact odds.
Most factors have long dry spells
A win rate shows how often a factor beat the market, but not when or for how long. A relative strength chart fills that gap. It shows that some factors trailed the Nifty 500 for years, and one for over a decade.
How to read the chart below: each line is the factor index divided by the Nifty 500, set to 100 on 1 January 2009. The dashed line at 100 is the market itself.
- Above 100: the factor has grown more than the market since 2009. Below 100: it has grown less.
- Rising line: the factor is beating the market at that time. Falling line: it is lagging. Flat line: it is keeping pace.
- Below 100 is not a loss. Dividend Opportunities sits at about 94, yet ₹100 put into it in 2009 grew to ₹866. It just grew less than the market.
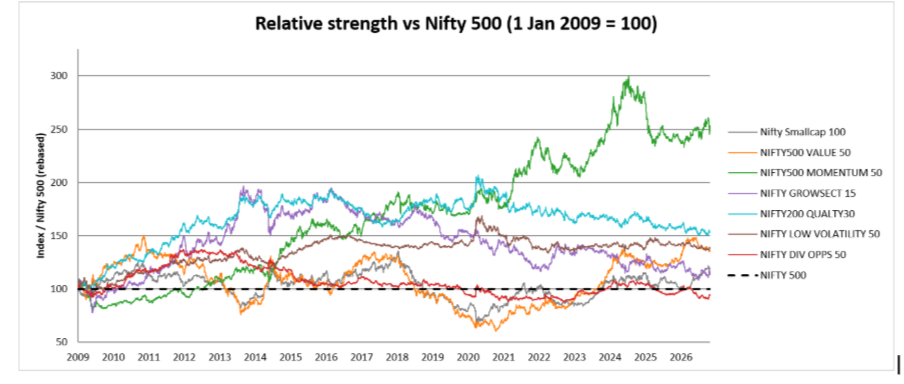
Factor index ÷ Nifty 500, rebased to 100 on 1 January 2009. Daily data to 27 October 2026, price returns.
The cost of each dry spell
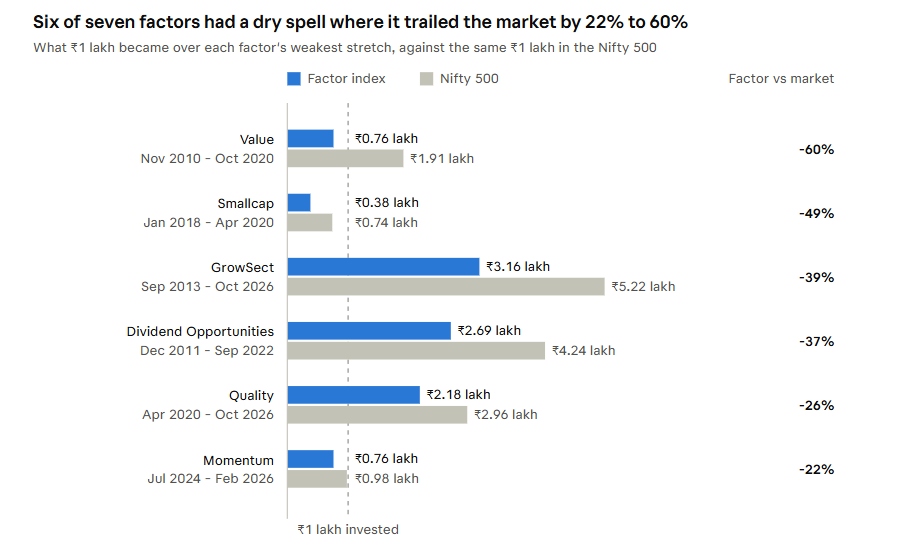
- Value trailed the market by about 60% from November 2010 to October 2020, with a rally in between. Then it turned: since October 2020, ₹1 lakh in Value grew to ₹5.01 lakh, against ₹2.23 lakh in the market. Anyone who gave up in 2019 missed it.
- Smallcap fell almost half behind the market from January 2018 to April 2020. Since then, ₹1 lakh has grown to ₹5.11 lakh, compared with ₹3.04 lakh in the market.
- GrowSect performed well from 2009 to 2013, then lost about 40% relative to the market. It sits above 100 only because of those early gains.
- Dividend Opportunities peaked against the market in December 2011 and drifted lower for almost 11 years.
- Quality earned its whole long-term lead before 2020. It has lagged for more than six years since its April 2020 peak.
- Momentum is the only line with a lasting uptrend. Even so, it fell 22% behind the market between July 2024 and February 2026, which is most of its life as a live index.
- Low Volatility had no deep dry spell. Since 2015, it has roughly kept pace: ₹1 lakh has grown to ₹3.33 lakh, compared with ₹3.20 lakh in the market.
The win rate tells you how often a factor led. This chart tells you how long its bad patches lasted.
The takeaway
Factors can beat the market over long periods, but none does it all the time. Six of seven Nifty factor indices have beaten the Nifty 500 since 2009, yet most spent years trailing it along the way.
- Each factor yielded a different result. Momentum led in almost every period. Quality and Low Volatility gave the smoothest ride. Value and Smallcap paid off only for investors who sat through deep slumps. Adjusted for risk, the order changes. Low Volatility earned the most for each unit of volatility (1.13), followed by Quality (1.06) and Momentum (0.99), all well above the market’s 0.76. Value (0.64) and Smallcap (0.68) earned less per unit of risk than the market itself because their returns came with the largest yearly swings: 24% and 21%, respectively.
- One return number can mislead. Start one year earlier and the market’s yearly growth rate drops from 13.3% to 7.7%. Rolling returns and relative strength give a truer picture.
- Dry spells can last years. Value trailed the market for a decade before more than doubling against it. Quality has lagged for six years. Even Momentum slipped 22% behind after July 2024.
- Leadership rotates. No one knows which factor will lead next. That is why many investors combine factors that behave differently rather than betting on one.
Buffett’s record carries the same lesson. His edge came from owning cheap, strong businesses for decades, including through painful stretches. Factor investing is not a shortcut to beating the market every year. It is a rules-based way to tilt a portfolio towards traits that have paid off over long periods, for investors who can stay put when those traits are out of favour.
Index data is shown for education only and is not a recommendation to buy or sell. Past performance is not indicative of future returns.
Disclaimer: Investment in securities market are subject to market risks. Read all the related documents carefully before investing. Registration granted by SEBI, membership of a SEBI recognized supervisory body (if any) and certification from NISM in no way guarantee performance of the intermediary or provide any assurance of returns to investors.
The content in these posts/articles is for informational and educational purposes only and should not be construed as professional financial advice and nor to be construed as an offer to buy /sell or the solicitation of an offer to buy/sell any security or financial products.Users must make their own investment decisions based on their specific investment objective and financial position and using such independent advisors as they believe necessary.
Windmill Capital Team: Windmill Capital Private Limited is a SEBI registered research analyst (Regn. No. INH200007645) based in Bengaluru at No 51 Le Parc Richmonde, Richmond Road, Shanthala Nagar, Bangalore, Karnataka – 560025 creating Thematic & Quantamental curated stock/ETF portfolios. Data analysis is the heart and soul behind our portfolio construction & with 50+ offerings, we have something for everyone. CIN of the company is U74999KA2020PTC132398. For more information and disclosures, visit our disclosures page here.


You may want to read
 The 2026 US Midterms and AI Stocks: What Happened and What’s Next
 Glide-Path Investing: How Your Portfolio Changes as Your Goal Approaches
 Hidden Engine Behind Jewellery Stores – Understanding Gold Metal Loans